Ready to burst? Everybody is talking about the housing market and if it's a bubble, and if so, when it will burst. We generally agree with
Billmon on this (that it's likely, but one can never be sure). We remember 'bubble' magazine covers in early 1999, and we're inclined to think that housing will have peaked about a year from now - possibly sooner if there are continued high oil prices.
In any event, we offer this cautionary example.
Okay, this week
Time magazine covers housing.

But consider this cover for the November 10,
1997 edition of
U.S.News.
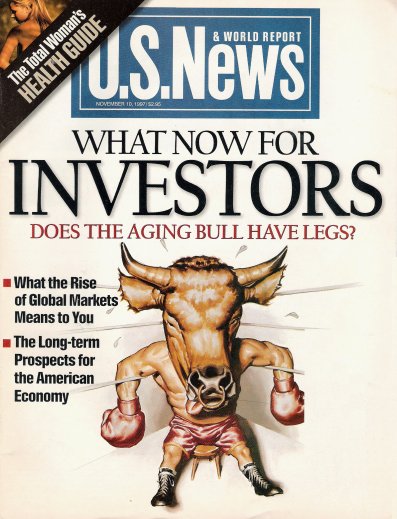 At that time
, it was considered by many that the bull had run its course and a period of consolidation was warranted. But the bull kept on going, even past the
LTCM/Russian crisis of 1998.
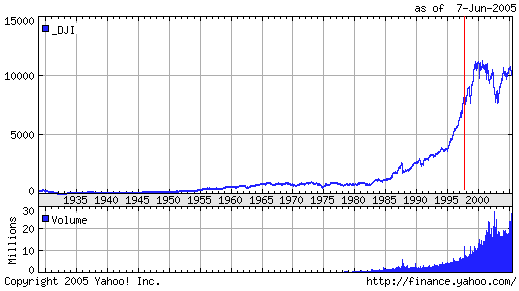
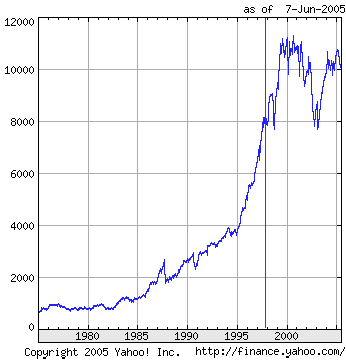
The trajectory above was for the relatively staid DOW. The NASDAQ, on the other hand, had even bigger surprises for everyone.
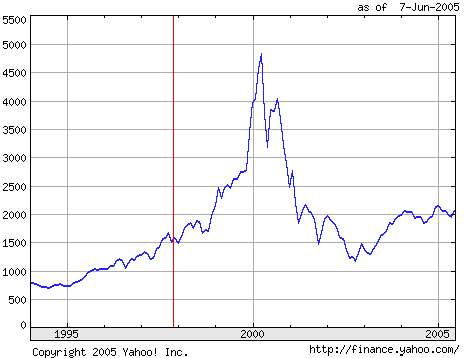
NOTE: Yes, we know we are using linear scaling and that a log chart is less dramatic.
posted by Quiddity at 6/08/2005 05:36:00 AM
It really doesn't matter in this case that the chart is linearly scaled, does it? These measures behave in a linear-type matter, not a log-type like decibel measurements...
What's interesting about both these charts is the fall in both indices is to a value just below that of the Nov 1997 "bull has run its course" level.
Although I hate to admit it, it feels like I should...I'm completely at sea with this shit, and I'm a reasonably intelligent person. Trying to figure out the charts and economicspeak about the housing sitch that have been strewing the airwaves and bandwidth and newsprint is, for me, like trying to learn Maori on my own. Is there anywhere I can pick it up in the language of the hoi-polloi (which I speak fluently)?
And Constantine, I'm ordained.
Rev. Apricot Hoecake
d/b/a